
Note: This is second in a series of posts on county health rankings from the Robert Wood Johnson Foundation. The first post on Length of Life can be found here.
The Robert Wood Johnson Foundation (RWJF) releases annual county rankings on different aspects of community wellness across five major categories – Length of Life, Quality of Life, Health Behaviors, Clinical Care, and Social and Economic Factors. This blog focuses on Quality of Life measures in North Carolina counties.
How RWJF Develops the Quality of Life County Health Ranking
RWJF develops a composite ranking for a county’s quality of life based on self-reported health data from the Behavioral Risk Factor Surveillance Survey (BRFSS) as well as vital statistics from the National Center for Health Statistics. Four sub-factors are used in this county health measure:
Quality of Life rankings help to indicate the prevalence and severity of diseases, disabilities, and other chronic conditions that exist in a community. These four measures used by RWJF encompass different aspects of a community’s quality of life. The first three measures (derived from BRFSS data) assess the physical and mental health conditions of a county’s residents. Previous research indicates that counties with more unhealthy days were more likely to have higher rates of unemployment and poverty, a greater percentage of adults that did not finish high school, and a greater prevalence of disability, highlighting the interrelationship between economic conditions and health.
Meanwhile, Low Birthweight (LBW) is a useful community health indicator as it represents both child and maternal health. LBW children are more likely to have growth and developmental issues, develop cardiovascular and respiratory conditions later in life, and have higher rates of physical and mental impairments. LBW also helps to indicate maternal access to health care and exposure to health risks.
County Health Rankings
The five North Carolina counties that ranked highest in Quality of Life – Dare, Wake, Currituck, Orange, and Camden – performed better than the state average on all four of the Quality of Life sub-factors. Orange, Wake, and Camden counties also ranked lowest in premature death – the measure used to rank length of life by RWJF. Residents in these counties tend to have higher rates of educational attainment and better access to healthcare, which is strongly tied to better quality of life outcomes.
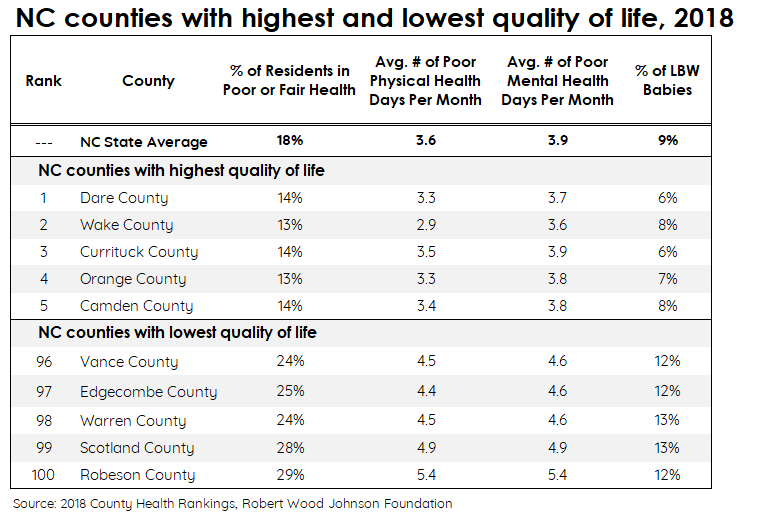
By comparison, the five lowest-ranking counties (Robeson, Scotland, Warren, Edgecombe, and Vance) all performed much worse than the state average across all four measures. Two of these (Robeson and Vance) were among the five counties with the highest rates of premature death, as well. Across all five counties, over a quarter of residents (26%) reported being in poor or fair health at the time of the survey.
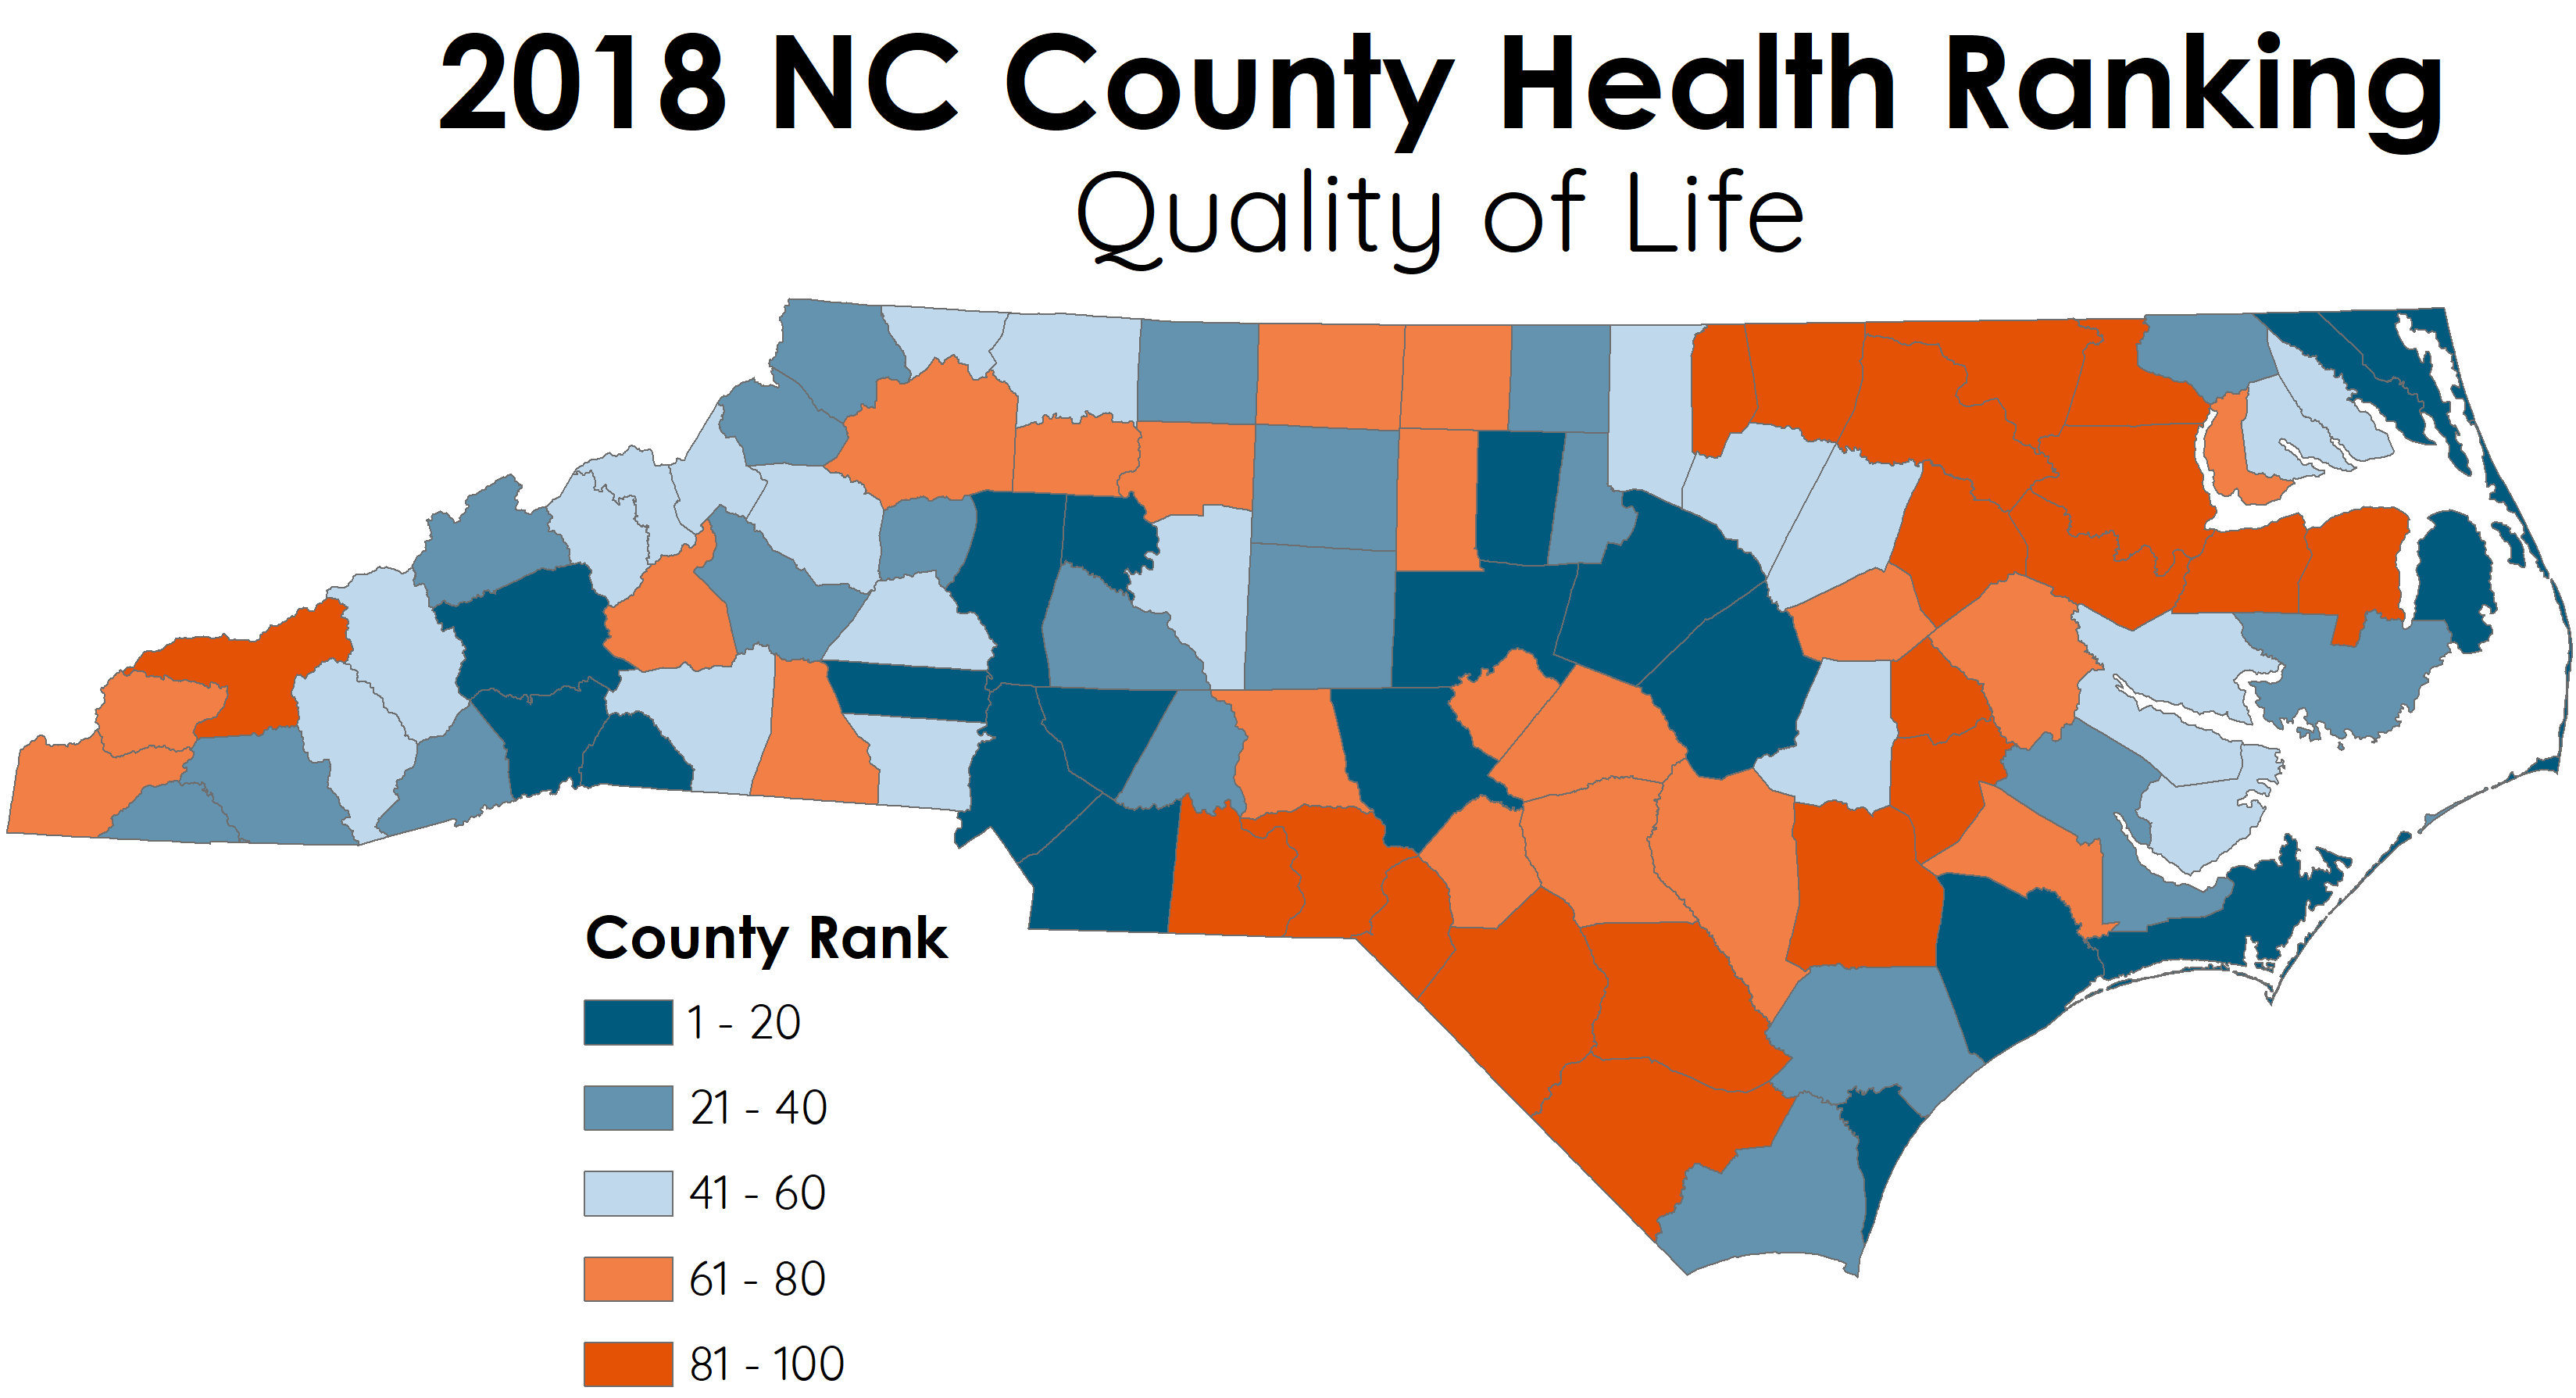
Across the state, counties in the northeast and Sandhills tended to have the worst quality of life rankings, while counties in the Charlotte metro, Triangle metro, and along the coast ranked highest.
Racial/Ethnic Disparities in Quality of Life
Quality of Life indicators vary widely by race and ethnicity in North Carolina. Asian residents in the state were the only demographic group that performed as well as or better than the state average in all four Quality of Life sub-factors. Meanwhile, American Indian residents were the only demographic group that performed worse than the state average across all four components.
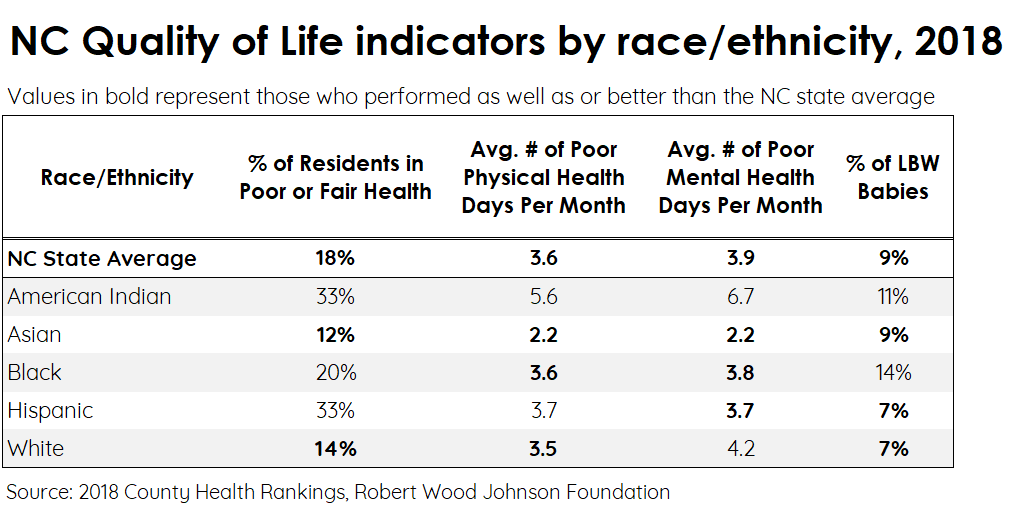
For the Black, Hispanic, and White groups, Quality of Life measures presented mixed results. Although one in five Black residents reported being in poor or fair health (two percentage points higher than the state average), the number of days per month spent in poor physical or mental health were comparable to the state overall. A third of Hispanic adults also reported being in poor or fair health, though babies born to Hispanic mothers were two percentage points less likely than the state average to be born underweight. Finally, White respondents were less likely to report being in poor or fair health than other demographic groups, but had the second-highest average number of days spent in poor mental health among the five demographic groups. This was nearly 8% greater than the state average.
These results indicate the complexity of these health measures and highlight the specific challenges present for certain geographic and racial/ethnic communities.
Need help understanding population change and its impacts on your community or business? Carolina Demography offers demographic research tailored to your needs.
Contact us today for a free initial consultation.
Contact UsCategories: NC in Focus
Tags: counties, county health rankings, health, health inequalities, Robert Wood Johnson Foundation, RWJF

The Center for Women’s Health Research (CWHR) at the University of North Carolina School of Medicine released the 12th edition of our North Carolina Women’s Health Report Card on May 9, 2022. This document is a progress report on the…

Dr. Krista Perreira is a health economist who studies disparities in health, education, and economic well-being. In collaboration with the Urban Institute, she recently co-led a study funded by the Kate B. Reynolds Foundation to study barriers to access to…

Our material helped the NC Local News Lab Fund better understand and then prioritize their funding to better serve existing and future grant recipients in North Carolina. The North Carolina Local News Lab Fund was established in 2017 to strengthen…
Your support is critical to our mission of measuring, understanding, and predicting population change and its impact. Donate to Carolina Demography today.